Review
Similar Products
|
Miltenyi Biotec
sox1 Sox1, supplied by Miltenyi Biotec, used in various techniques. Bioz Stars score: 94/100, based on 1 PubMed citations. ZERO BIAS - scores, article reviews, protocol conditions and more https://www.bioz.com/result/sox1/product/Miltenyi Biotec Average 94 stars, based on 1 article reviews
sox1 - by Bioz Stars,
2026-02
94/100 stars
|
Buy from Supplier |
|
Thermo Fisher
gene exp sox1 hs01057642 s1 Gene Exp Sox1 Hs01057642 S1, supplied by Thermo Fisher, used in various techniques. Bioz Stars score: 98/100, based on 1 PubMed citations. ZERO BIAS - scores, article reviews, protocol conditions and more https://www.bioz.com/result/gene exp sox1 hs01057642 s1/product/Thermo Fisher Average 98 stars, based on 1 article reviews
gene exp sox1 hs01057642 s1 - by Bioz Stars,
2026-02
98/100 stars
|
Buy from Supplier |
|
Proteintech
sox1  Sox1, supplied by Proteintech, used in various techniques. Bioz Stars score: 93/100, based on 1 PubMed citations. ZERO BIAS - scores, article reviews, protocol conditions and more https://www.bioz.com/result/sox1/product/Proteintech Average 93 stars, based on 1 article reviews
sox1 - by Bioz Stars,
2026-02
93/100 stars
|
Buy from Supplier |
|
Thermo Fisher
sox1 jj20-40 antibody Sox1 Jj20 40 Antibody, supplied by Thermo Fisher, used in various techniques. Bioz Stars score: 90/100, based on 1 PubMed citations. ZERO BIAS - scores, article reviews, protocol conditions and more https://www.bioz.com/result/sox1 jj20-40 antibody/product/Thermo Fisher Average 90 stars, based on 1 article reviews
sox1 jj20-40 antibody - by Bioz Stars,
2026-02
90/100 stars
|
Buy from Supplier |
|
Bio-Techne corporation
human/mouse/rat sox1 antibody Human/Mouse/Rat Sox1 Antibody, supplied by Bio-Techne corporation, used in various techniques. Bioz Stars score: 96/100, based on 1 PubMed citations. ZERO BIAS - scores, article reviews, protocol conditions and more https://www.bioz.com/result/human/mouse/rat sox1 antibody/product/Bio-Techne corporation Average 96 stars, based on 1 article reviews
human/mouse/rat sox1 antibody - by Bioz Stars,
2026-02
96/100 stars
|
Buy from Supplier |
|
Cell Signaling Technology Inc
sox1 Sox1, supplied by Cell Signaling Technology Inc, used in various techniques. Bioz Stars score: 95/100, based on 1 PubMed citations. ZERO BIAS - scores, article reviews, protocol conditions and more https://www.bioz.com/result/sox1/product/Cell Signaling Technology Inc Average 95 stars, based on 1 article reviews
sox1 - by Bioz Stars,
2026-02
95/100 stars
|
Buy from Supplier |
|
Cell Signaling Technology Inc
antibodies against sox1  Antibodies Against Sox1, supplied by Cell Signaling Technology Inc, used in various techniques. Bioz Stars score: 95/100, based on 1 PubMed citations. ZERO BIAS - scores, article reviews, protocol conditions and more https://www.bioz.com/result/antibodies against sox1/product/Cell Signaling Technology Inc Average 95 stars, based on 1 article reviews
antibodies against sox1 - by Bioz Stars,
2026-02
95/100 stars
|
Buy from Supplier |
Image Search Results
Journal: Biology
Article Title: Stage-Specific Alternative Polyadenylation During Human Neural Differentiation Revealed by Integrated Long- and Short-Read Sequencing
doi: 10.3390/biology15010024
Figure Lengend Snippet: Immunofluorescence staining showing the expression of neural stem/progenitor cell markers in H9-derived cells. The cell nuclei are labeled with DAPI (blue). Nestin was detected in green. OCT4, NANOG, and SOX1 were detected in red. PAX6 was detected in red in NSCs and in green in NPCs. Scale bar = 50 μm. Original figures see .
Article Snippet: Cells were fixed with 4% paraformaldehyde (PFA) at room temperature for 20 min, permeabilized with 0.25% Triton X-100 for 30 min and blocked with 5% donkey serum for 1 hr before incubating with primary antibodies including OCT4 (1:200, 962649, R&D System, Minneapolis, MN, USA), NANOG (1:100, 14295-1-AP, Proteintech, Rosemont, IL, USA), PAX6 (1:200, PRB-278P, BioLegend, San Diego, CA, USA), NESTIN (1:500, 809801, BioLegend), and
Techniques: Immunofluorescence, Staining, Expressing, Derivative Assay, Labeling
Journal: bioRxiv
Article Title: Induction and long-term maintenance of hindbrain-like neural stem cells in xeno- and basic fibroblast growth factor-free conditions
doi: 10.1101/2025.03.03.640169
Figure Lengend Snippet: (A) Schematic of the method used to induce human induced pluripotent stem cells (iPSCs) into hindbrain-like neural stem cells (Hb-LiNSCs). (B) Phase contrast images of iPSC and Hb-LiNSCs colonies, and differentiated neurons from left to right. Scale bar, 100 µm. (C) E-cadherin ( CDH1 ), N-cadherin ( CDH2 ), SOX1, SOX2, PAX6 , and POU5F1 gene expression in iNSCs during the induction phase relative to that on day 0 (iPS cells). Bars indicate means; error bars as standard deviation, n = 3. (D) Immunocytochemical staining for SOX1, SOX2, NESTIN, PAX6, NANOG, POU5F1, and that of nuclei with DAPI in Hb-LiNSCs at day 7 after induction of iPSCs. Scale bar, 50 µm. (E) Heatmap of selected genes representing pluripotency, neural stem cells, differentiated neurons, and canonical markers for the hindbrain region, with hierarchical clustering of genes and samples. Three samples of 1231A3 iPS (as control) and 1231A3 Hb-LiNSCs at PN0 day 7 were used. Normalized gene expression data are represented by the color intensity of the row z-scores. (F) Log foldchange values (x-axis) are plotted against significance (negative log 10 of p -adjusted value, y-axis) for PN0 day 7 Hb-LiNSC samples (three samples) vs. 1231A3 iPS control (three samples). Red color dots indicate significantly differentially expressed genes. Vertical dashed lines indicate the threshold of 1.5 log foldchange, and the horizontal dashed lines indicates the significance threshold ( p = 0.05). (G) Gene enrichment analysis of the significantly ( p < 0.05) upregulated (log 2 foldchange ≥1.5) genes in the PN0 Day 7 Hb-LiNSCs vs. iPSC control comparison for selected datasets. Dot size indicates the number of genes overlapping with the dataset, color intensity indicates the significance (top 10 terms ordered by p -values), and the x-axis indicates the combined score calculated using Enrichr. Relevant terms are highlighted in red.
Article Snippet: Hb-LiNSCs and/or attached neurospheres were fixed with 4% paraformaldehyde and then stained with
Techniques: Gene Expression, Standard Deviation, Staining, Control, Comparison
Journal: bioRxiv
Article Title: Induction and long-term maintenance of hindbrain-like neural stem cells in xeno- and basic fibroblast growth factor-free conditions
doi: 10.1101/2025.03.03.640169
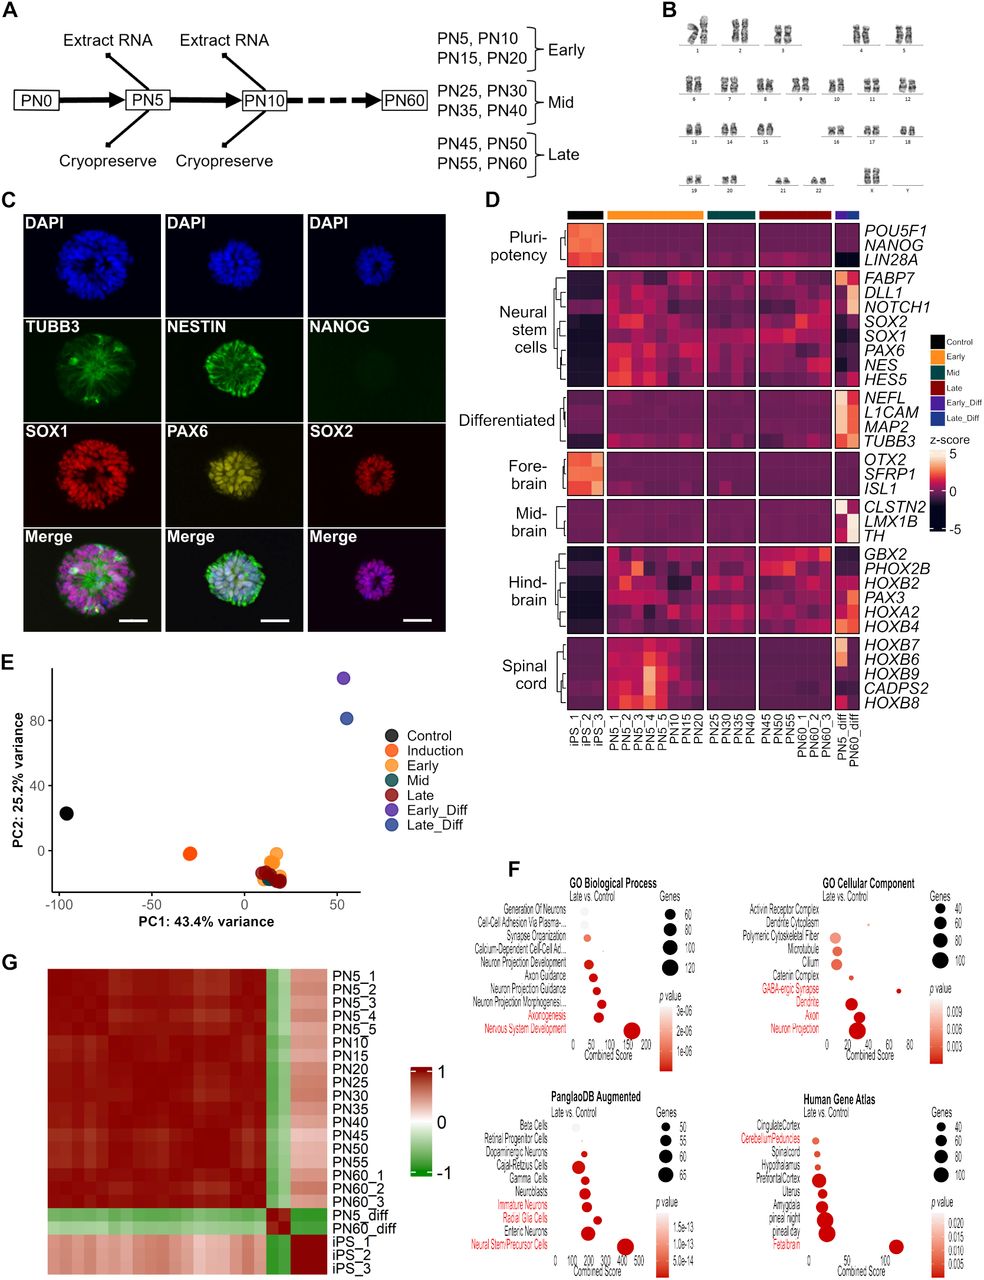
Figure Lengend Snippet: (A) Schematic of the maintenance plan (on the left). Hindbrain-like neural stem cells (Hb-LiNSCs) were passaged every week, and thereafter, at every fifth passage, one clone of cells was cryopreserved, one was used to extract bulk RNA, and one was used for maintaining the culture. The grouping into early, mid, and late samples according to the passage number is shown on the right. (B) Karyotyping of Hb-LiNSCs at PN53 derived from the 1231A3 human iPSC line. (C) Immunocytochemical staining of Hb-LiNSCs for TUBB3, SOX1, NESTIN, PAX6, NANOG, and SOX2, and that of nuclei with DAPI at PN60 (60 weeks) after induction of iPSCs. Scale bar, 50 µm. (D) Heatmap of selected genes representing pluripotency, NSC, neural differentiation, and canonical markers for different brain regions, with hierarchical clustering of genes. The colored bar on the top indicates the samples. Samples PN5_1 to PN5_3 and PN60_1 to PN60_3 were derived from the 1231A3 iPSC line. Samples PN5_4 and PN5_5 were derived from HLAKO and SgT5 iPSC lines, respectively. “_diff” stands for differentiated neurons. Normalized gene expression data are represented by the color intensity of the row z-scores. (E) Principal component analysis (PCA) plots of the first and second (PC1 and PC2) components for the iPSC control are indicated in red, and Hb-LiNSCs and their differentiated cells at early-, mid-, and late-passage numbers are indicated in green, purple, blue, respectively. (F) Gene enrichment analysis of the significantly ( p < 0.05) upregulated (log 2 foldchange ≥1.5) genes in the late PN group vs. iPSC control comparison for selected datasets. Dot size indicates the number of genes overlapping with the dataset, color intensity indicates the significance (top 10 terms ordered by p -values), and the x-axis indicates the combined score calculated using Enrichr. Relevant terms are highlighted in red. (G) Pairwise correlation heatmap showing the relationships among samples. The color intensity in the heatmap indicates the correlation, ranging from 1 (positive correlation) in red through 0 (no correlation) in white to −1 (negative correlation) in green.
Article Snippet: Hb-LiNSCs and/or attached neurospheres were fixed with 4% paraformaldehyde and then stained with
Techniques: Derivative Assay, Staining, Gene Expression, Control, Comparison